


Abstract
In some individuals with obstructive sleep apnoea (OSA), the palate prolapses into the velopharynx during expiration, limiting airflow through the nose or shunting it out of the mouth. We hypothesised that this phenomenon causes expiratory flow limitation (EFL) and is associated with inspiratory “isolated” palatal collapse. We also wanted to provide a robust noninvasive means to identify this mechanism of obstruction.
Using natural sleep endoscopy, 1211 breaths from 22 OSA patients were scored as having or not having palatal prolapse. The patient-level site of collapse (tongue-related, isolated palate, pharyngeal lateral walls and epiglottis) was also characterised. EFL was quantified using expiratory resistance at maximal epiglottic pressure. A noninvasive EFL index (EFLI) was developed to detect the presence of palatal prolapse and EFL using the flow signal alone. In addition, the validity of using nasal pressure was assessed.
A cut-off value of EFLI >0.8 detected the presence of palatal prolapse and EFL with an accuracy of >95% and 82%, respectively. The proportion of breaths with palatal prolapse predicted isolated inspiratory palatal collapse with 90% accuracy.
This study demonstrates that expiratory palatal prolapse can be quantified noninvasively, is associated with EFL and predicts the presence of inspiratory isolated palatal collapse.
Abstract
Expiratory palatal prolapse can be quantified noninvasively and predicts inspiratory isolated palatal collapse http://ow.ly/vm6c30hB839
Introduction
Obstructive sleep apnoea (OSA) is a common disorder characterised by recurrent upper airway collapse during sleep [1], which causes sleep fragmentation [2] and sympathetic activation [3]. Untreated OSA has also been associated with adverse neurocognitive (daytime sleepiness, reduced attention) [4–6] and cardiometabolic complications (hypertension, diabetes, strokes) [4, 7, 8].
In patients with OSA, upper airway obstruction is caused by collapse at one or more pharyngeal sites during sleep (palate, tongue base, lateral walls and epiglottis) [9, 10]. In the course of existing investigations by our group to identify these structure(s) endoscopically, we observed that, in some individuals, the soft palate and uvula prolapsed (ballooned) into the velopharynx during expiration (figure 1). These instances were easy to recognise because they produced substantial pharyngeal narrowing/fluttering and occasional redirection of expiratory flow out of the mouth (unidirectional airflow, i.e. breathing in through the nose and out through the mouth). The movement of the involved floppy tissues (soft palate and uvula) was often quite dramatic and caused arousals.
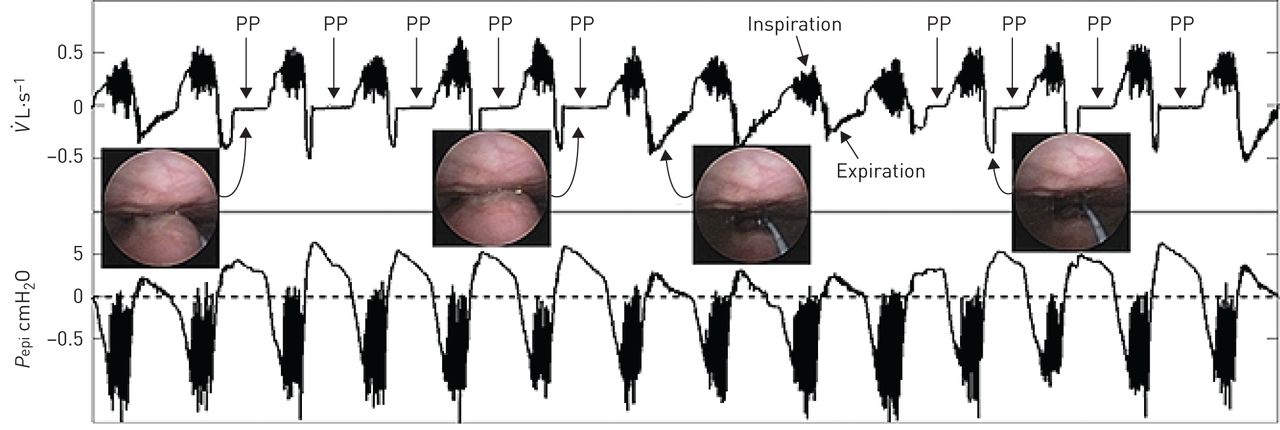
Protrusion or “ballooning” of the palate into the velopharynx during expiration (palatal prolapse, indicated by “PP”). The two endoscopic images on the left display the palatal prolapse from the velopharyngeal view of the airway during expiration in two different breaths. The third endoscopic image from the left shows an open airway during normal expiration. The right endoscopic image also displays an open airway just before the occurrence of the palatal prolapse. The top trace shows the pneumotachograph-measured airflow ( ) and the bottom trace demonstrates the simultaneously measured epiglottic pressure (Pepi). This figure clearly shows a distinct and reproducible expiratory flow pattern whenever the palate prolapses (balloons) into the velopharynx. Expiratory flow limitation is observed from the lack of increase in expiratory flow despite an increase in epiglottic pressure during a period with repeated palatal prolapse (arrows identified with palatal prolapse). During palatal prolapse, expiratory positive airway pressure develops at the level of the epiglottis and is not associated with a corresponding increase in the expiratory nasal flow.
In addition, research shows that expiratory flow limitation (EFL), which is coupled with inspiratory flow limitation in 50% of the breaths [11], is a common clinical finding [11–14], and could potentially be used to predict obstructive pulmonary disease [15] and the efficiency of mask ventilation during anaesthesia induction [16] in patients with sleep disordered breathing. However, the mechanism of action remains unknown.
We hypothesised that EFL is typically caused by palatal prolapse. Therefore, we analysed endoscopy videos recorded simultaneously with flow and epiglottic pressure during natural sleep to examine this hypothesis. Furthermore, we hypothesised that palatal prolapse produces well-defined, reproducible intra-breath expiratory airflow characteristics during sleep that can be automatically identified from expiratory flow (measured by both a pneumotachograph and a nasal cannula) such that palatal prolapse can be diagnosed from the clinical polysomnogram. Therefore, we developed and validated an EFL index (EFLI, a positive number between 0 and 1 (most severe flow limitation) calculated from flow) to detect the presence of expiratory prolapse as defined by gold standard endoscopy. In addition, the association between palatal prolapse and the structure(s) causing inspiratory airway collapse was also examined. Furthermore, as an additional clinical validation, pneumotachograph flow and nasal pressure were measured simultaneously on a separate subgroup of patients. The correlation between pneumotachograph flow and nasal pressure EFLI was determined.
Methods
Participants
The current results were obtained by additional analysis of data obtained in investigations of the association between structures causing upper airway collapse and airflow patterns [17, 18]. Briefly, OSA patients with an apnoea–hypopnoea index (AHI) >10 events·h−1 were invited to participate. Exclusion criteria included use of respiratory stimulants or depressants (including opioids and benzodiazepines), heart failure or lung diseases, central sleep apnoea and pregnancy. Participants provided written informed consent and approval was granted by our hospital's institutional review board.
Endoscopic studies
Setup
Participants were instrumented for a physiological polysomnogram including electroencephalography (EEG), chin electromyography (EMG), electro-oculography (EOG), electrocardiography (ECG), thoracoabdominal movements, body position and pulse oximetry. Sleep, arousals and respiratory events were scored according to standard clinical criteria (hypopnoeas: 30% reduction in flow with ≥3% desaturation or arousal) [19]. Ventilatory flow was assessed via a pneumotachograph (Hans Rudolph, Shawnee, KS, USA) attached to a sealed nasal mask. Mask pressure was monitored with a pressure transducer (Validyne, Northridge, CA, USA) referenced to atmosphere. Pharyngeal lumen pressure was measured with a 5-French Millar catheter (with six pressure sensors 0.75 cm apart) inserted through a nostril with the tip placed in the hypopharynx. To visualise the airway, a 2.8-mm diameter paediatric bronchoscope was inserted through the second nostril. All signals except EEG, EMG, EOG and ECG (which were sampled at 125 Hz) were captured at a sampling frequency of 500 Hz, and the images were sampled at 30 frames·s−1.
Protocol
Participants were asked to sleep in either the supine or lateral position. The scope's tip was initially placed above the soft palate to visualise the velopharynx. The tip of the scope was then advanced to the oropharynx to visualise the oropharyngeal and hypopharyngeal structures. This process was repeated with as many breaths being observed at both pharyngeal levels as possible throughout the night.
Gold standard endoscopic classification and gold standard EFL
Due to the invasiveness of the study and the inherent challenges in performing endoscopy during natural sleep in OSA patients, it was not feasible to visualise the pharyngeal structure for all breaths throughout the night. Breaths were excluded if they occurred during: 1) arousals, 2) rapid eye movement (REM) sleep, 2) when the tip of the scope was in the oropharynx, 3) when mucus or saliva blurred the endoscopic view or 4) when the lighting was not adequate. The remaining breaths during non-REM sleep were labelled as being associated with palatal prolapse or not, based on visual inspection of the endoscopic videos. The breaths were labelled as palatal prolapse if the palate prolapsed (free edge of palate flipped into a caudal direction, see figure 2b) or ballooned (>50% narrowing of the velopharynx due to posterior movement of the palate) into the nasopharynx on expiration.

In some patients, the soft palate and uvula prolapse (balloon) into the velopharynx during expiration, producing substantial pharyngeal narrowing and redirection of expiratory flow out of the mouth (breathing a) in through nose and b) out through the mouth). The airflow demonstrated in this figure only shows the nasal flow measured by a pneumotachograph attached to a nasal mask.
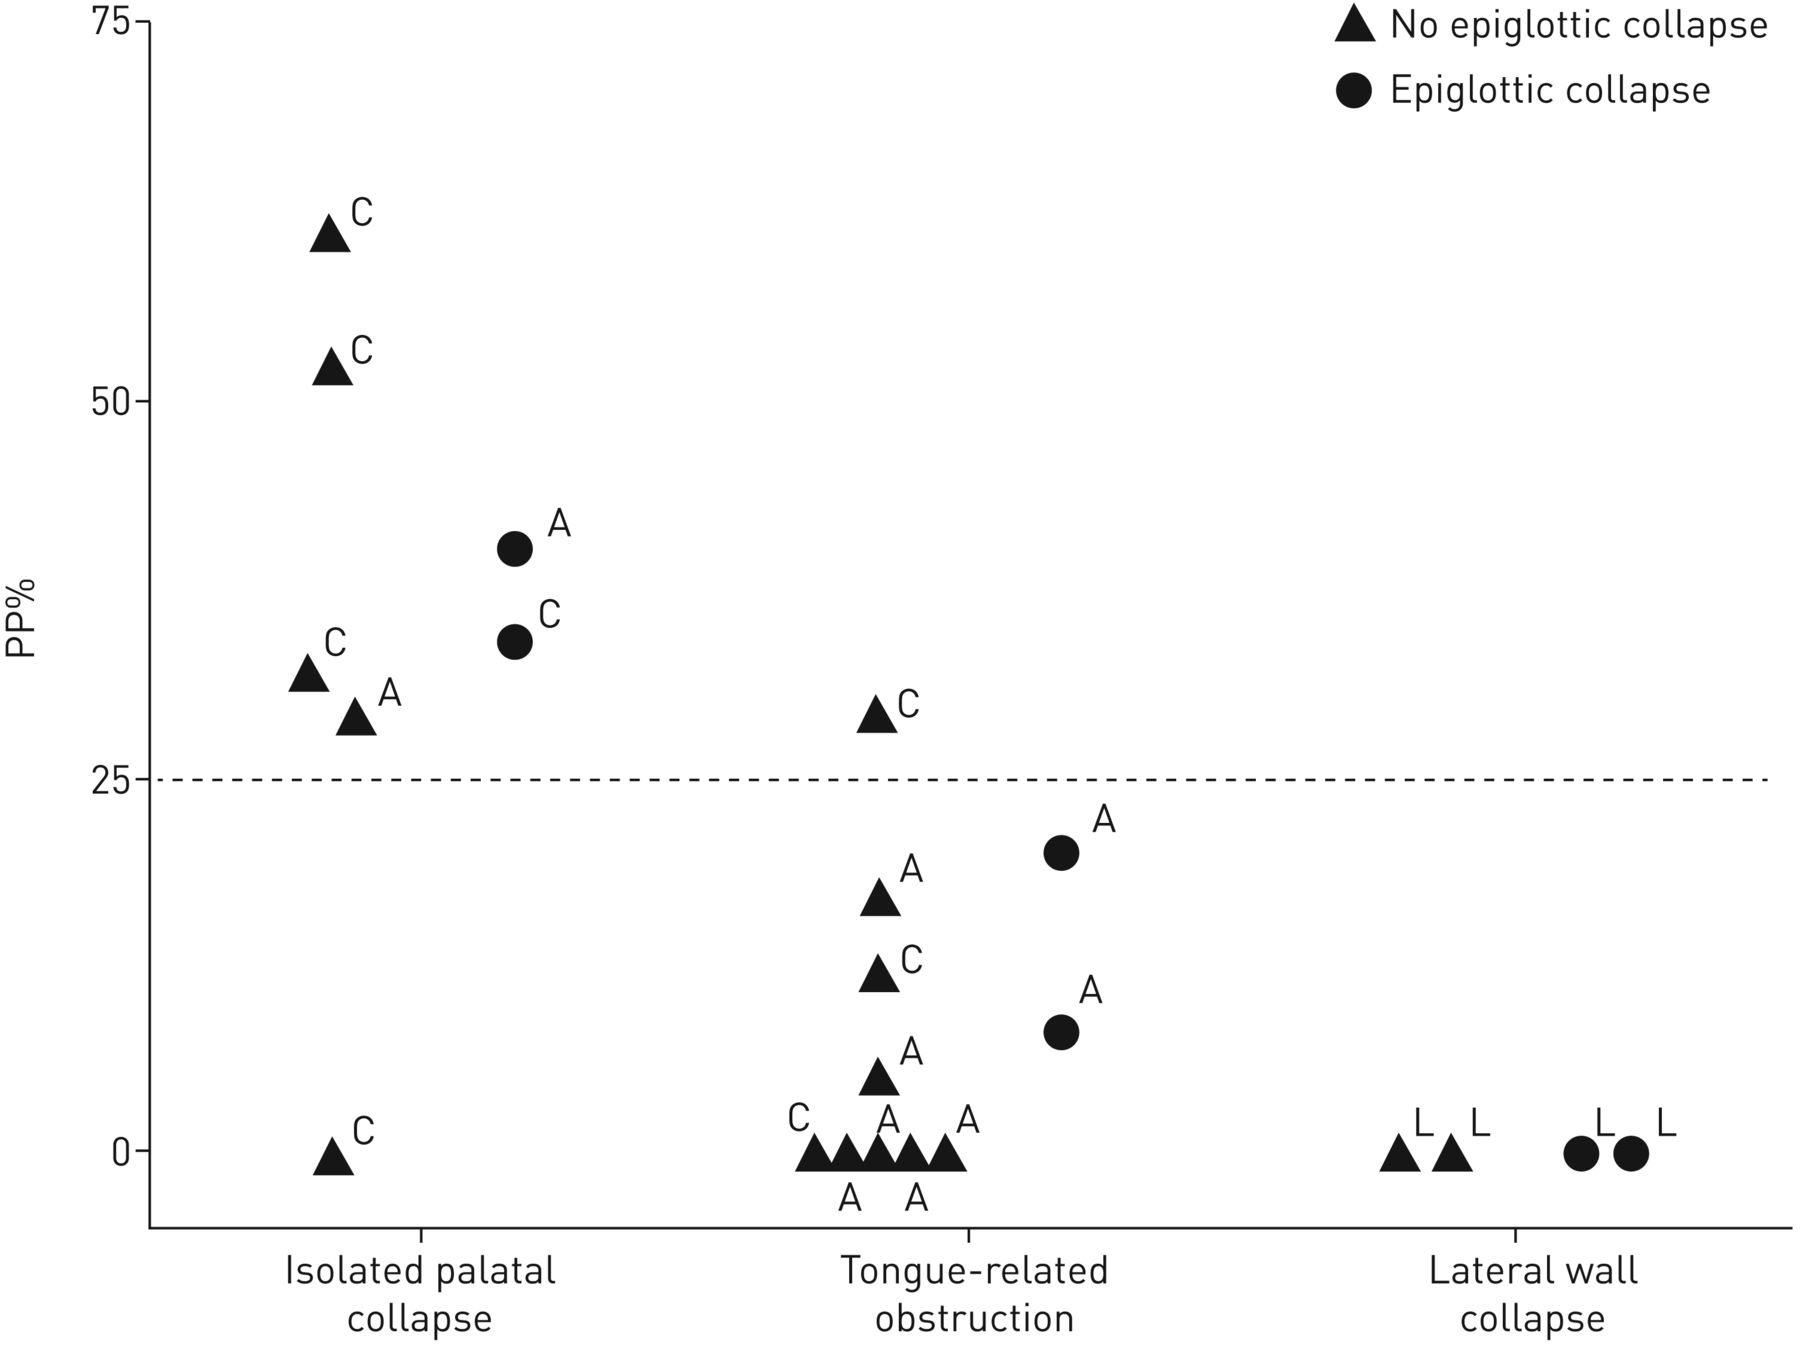
The site or mechanism of airway collapse was classified as either tongue-related obstruction, isolated palatal collapse, pharyngeal lateral wall collapse and/or epiglottic collapse. The classification was performed as described in a previous publication [17]. Briefly, the primary structure causing collapse was considered the tongue if it was “posteriorly located” during end-expiration (touching the epiglottis and/or pushing the epiglottis posteriorly and obscuring the vocal cords). Due to the anatomical relationship between the tongue and the palate, tongue-related obstruction was almost always associated with palatal obstruction as well. The lateral walls were considered the primary site of collapse if they narrowed the airway in the lateral dimension on both inspiration and expiration. Epiglottic collapse was defined as either anteroposterior or lateral (folding) collapse of the epiglottis [17, 18]. Isolated palatal collapse was defined as collapse at the level of palate without any involvement of other airway structures. When more than one structure was involved in obstruction, the structure collapsing at the least negative pharyngeal pressure was considered predominant. This classification was performed on a patient-level basis by two investigators, with discrepancies being resolved by a third investigator. To characterise the association between palatal prolapse and the site of inspiratory collapse, the proportion of breaths with palatal prolapse (PP%, % breaths endoscoped) was calculated for each patient.
EFL was determined based on simultaneous observations of flow and epiglottic pressure and by measuring expiratory resistance at peak epiglottic pressure during expiration). Raw was defined as Raw=Pepimax/ exp. Breaths with Raw>20 cmH2O·s·L−1 were labelled as EFL. To determine the Raw cut-off of 20 cmH2O·s·L−1 for each breath, the resistance at peak expiratory flow was determined (supplementary figure S1). We assumed that at the time of peak expiratory flow, the resistance would be normal for the majority of breaths; this value was 8.0 (5.7–11.7) cmH2O·s·L−1 (values in the parentheses are the interquartile range (IQR)). The Raw cut-off for EFL detection was set as the median plus two IQRs, which was 20 cmH2O·s·L−1. Of note, our use of Raw in no way implies a linear (ohmic) relationship between pressure and flow or that Raw is a characteristic measure of the collapsibility independent of pressure. Also, given the extensive range of expiratory resistance in non-EFL breaths (i.e. 1≤Raw≤20 cmH2O·s·L−1), the term “less-expiratory flow limitation” may be more appropriate. However, for simplicity all the breaths with Raw≤20 cmH2O·s·L−1 were called non-EFL breaths.
Noninvasive EFLI
We hypothesised that palatal prolapse causes EFL and produces a distinct flow shape during expiration (figure 1) that can be identified objectively. Therefore, we sought to quantify this distinct expiratory flow shape in an automated manner.
To automate the recognition of palatal prolapse and EFL, expiratory flow ( exp) was first automatically identified [20]. The distinct expiratory flow shape (shown in figures 1 and 2) was quantified by dividing the expiratory flow into its even (symmetric) and odd (asymmetric) components and measuring the root-mean-square of the odd component. See supplementary material for detailed calculation of EFLI and further rationale of why this signal processing technique was used.
Association between palatal prolapse and gold standard EFL
All breaths were scored as palatal prolapse or nonpalatal prolapse using endoscopy as well as “EFL” or “non-EFL” using flow and epiglottic pressure (by calculating resistance at peak epiglottic pressure). The association between palatal prolapse and EFL was determined using Fisher's exact test.
Determining the EFLI threshold for expiratory flow limited breaths
The next step was to obtain the same information from the flow signal. Therefore, to determine the EFLI threshold, the data were split into two sets: a training set (n=606 breaths) and a validation set (n=605 breaths). From the training set, the threshold was identified using a receiver operating characteristic (ROC) curve and maximising the performance of the classifier, i.e. the EFLI. The sensitivity and specificity of this threshold were then tested using the validation set.
Clinical validation on simultaneously measured pneumotachograph flow and nasal pressure
A total of 10 patients completed a prospective validation polysomnography [18, 21] to assess the validity of using nasal pressure as a clinical surrogate of ventilatory flow in our method. To simultaneously measure nasal pressure (nasal cannula) and ventilatory flow (pneumotachograph with oronasal mask), a modified cannula (Hudson RCI “over-the-ear”, cut to fit under the mask; Teleflex, Morrisville, NC, USA) provided a nasal pressure signal that was referenced to mask pressure to reflect the pressure signal available clinically. 1768 breaths (mean±sd 177±75 breaths per subject) were randomly selected from these polysomnograms. For each breath, the EFLI was estimated using nasal pressure (linearised using square root transformation [22, 23]) and then separately quantified using pneumotachograph flow for comparison.
Effect of EFL on the end-expiratory lung volume
To examine whether the end-expiratory lung volume (EELV) increased as a result of EFL (expiratory resistance) during sleep [24], additional analysis was performed in 10 individuals. Briefly, the changes in EELV (thorax and abdomen movements using calibrated DC-coupled inductance plethysmography, see supplementary material) were characterised for five-breath periods with and without EFL (i.e. EFLI <0.8). A total of 102 five-breath intervals during sleep were labelled as EFL (n=40) and non-EFL (n=62). Both EFL and non-EFL intervals were preceded by a clear non-EFL breath, which was defined as the baseline breath for each interval. EFLI and the change in EELV were calculated for each breath.
Statistical analyses
Data are expressed as the mean±standard deviation or mean±standard error, unless otherwise specified. Unpaired two-tailed t-tests or Wilcoxon signed-rank tests were performed for between-group comparisons. Fisher's exact test was used for associations between categorical variables. A Kruskal–Wallis test along with a Dunn's multiple comparisons test was used to test whether PP% differs among different sites of collapse on inspiration. As, in the same patient, the epiglottic collapse always occurred in addition to one other site of collapse, we excluded it from the Kruskal–Wallis analysis. Simple linear regression was used to model the relationship between the pneumotach-measured EFLI and the nasal pressure-measured EFLI. Statistical significance was accepted at p<0.05. Analyses were performed using MATLAB software (MathWorks, Natick, MA, USA).
Results
Endoscopic studies
Patient characteristics
The endoscopy study involved 22 OSA patients (mean±sd age 51.6±8.2 years, seven females) with a mean±sd AHI of 48.5±28.9 events·h−1 and body mass index (BMI) of 33.1±6.2 kg·m−2. Table 1 presents participant characteristics and polysomnographic parameters.
Participant characteristics and polysomnographic parameters
Breaths verified by endoscopy
1211 breaths (mean±sd 55±26 breaths per subject) during non-REM sleep were analysed. From these breaths, 226 (18.7%) were scored as palatal prolapse and 985 (81.3%) were classified as nonpalatal prolapse. A Fisher's exact test was used to determine whether position had any effect on the occurrence of palatal prolapse. 28% of supine breaths were associated with palatal prolapse, while only 5% of lateral breaths were classified as palatal prolapse. This difference was statistically significant (p<0.0001).
Association of palatal prolapse with the site of airway collapse
The Kruskal–Wallis test revealed that the median PP% was significantly different among inspiratory sites of collapse (Kruskal–Wallis statistic 10.94; p=0.0013). The Dunn's test revealed that PP% was significantly higher in patients with isolated palatal collapse than patients with tongue-related obstructions (mean rank difference 7.5; p=0.036) and lateral wall collapse (mean rank difference 11.9; p=0.0063). PP% was similar between patients with tongue-related obstructions and lateral wall collapse (mean rank difference 4.4; p=0.67). Figure 3 shows the scatter plot of PP% for all individuals. For a cut-off of PP% >25%, the sensitivity/specificity of identifying patients with palatal collapse was 85.7%/93.3%. The sensitivity/specificity was exactly the same for a cut-off of EFLI >0.8.

Scatter plot of the proportion of breaths with palatal prolapse (PP%, % breaths endoscoped) for all individuals. Patients classified as isolated palatal collapse had significantly higher PP% than patients with tongue-related obstruction and pharyngeal lateral wall collapse. The occurrence of epiglottic collapse was not expected to change PP%. The direction of airway collapse at the palate is also shown for each individual: concentric (C), anteroposterior (A) or lateral (L). Note that a similar threshold of 25% was obtained if the proportion of breaths with expiratory flow limitation index >0.8 (EFL%) was used instead of PP%.
Association between palatal prolapse and EFL
93% of palatal prolapse breaths exhibited EFL as opposed to only 11% of nonpalatal prolapse breaths. This difference was statistically significant (two-tailed p<0.0001). This indicates that ∼89% of EFL breaths are associated with palatal prolapse.
EFLI accuracy in determining palatal prolapse and EFL
The ROC curve analysis of EFLI in determining palatal prolapse resulted in a mean±se area under the curve (AUC) of 0.997±0.0013 (p<0.0001). A threshold EFLI of 0.8 was chosen to distinguish palatal prolapse breaths (EFLI >0.8) from nonpalatal prolapse breaths. This resulted in a mean±se sensitivity of 94±2.6% and specificity of 99±0.5% when used in the training set. When the threshold EFLI of 0.8 was applied to the test set, a mean±se sensitivity of 92±3.1% and specificity of 99±0.8% were obtained. As shown in figure 4, the distributions of EFLI for breaths with and without palatal prolapse are clearly different. A second ROC curve analysis was performed to distinguish EFL breaths (Raw>20 cmH2O·s·L−1) from non-EFL breaths using EFLI. This resulted in a mean±se AUC of 0.82±0.02 (p<0.0001). The same threshold of EFLI of 0.8 resulted in an accuracy of 82% in detecting EFL breaths. Interestingly, if breaths with Raw>25 cmH2O·s·L−1 were considered as EFL breaths, the mean±se AUC increased to 0.86±0.02 (p<0.0001) and the threshold of EFLI of 0.8 resulted in a higher accuracy of 85% in detecting EFL breaths. This indicates that palatal prolapse is likely to be associated with more severe EFL (quantified by higher Raw) that can be more accurately detected by EFLI calculated from “expiratory flow shapes”.

Breaths associated with expiratory flow limitation (EFL) clearly have a different EFL index (EFLI) distribution, resulting in high sensitivity and specificity for the detection of EFL.
Clinical studies with simultaneously measured pneumotachograph flow and nasal pressure
The nasal pressure study involved 10 different patients (mean±sd age 57.2±8.2 years; two females) with a mean±sd AHI of 42.0±25.5 events·h−1 and BMI of 29.6±6.5 kg·m−2 (table 1). Figure 5 demonstrates an example tracing of EFL during non-REM sleep measured with both a full face mask plus pneumotachograph and a nasal cannula. The EFLI values obtained from the pneumotach-measured flow ( ) were strongly associated with their corresponding values obtained from both the nasal pressure (
 PN) (r=0.90; p<0.0001) and the linearised nasal pressure (
 PN0.5) (r=0.91; p<0.0001), indicating that EFL can be reliably detected from nasal pressure signals (supplementary figure S4).

An example tracing of expiratory flow limitation (EFL) during non-rapid eye movement sleep. Flow was measured with both a pneumotachograph ( ) and a nasal cannula (
 PN). Nasal pressure was also linearised using the square root transform (
 PN0.5). During EFL periods, expiratory positive airway pressure developed at the level of the epiglottis (Pepi) without any increase in expiratory flow. Thick dashed lines above the top trace show the scored arousals.
Effect of EFL on EELV
As EFL can cause positive end-expiratory pressure and thus potentially increase EELV, the change in EELV across a string of five EFL breaths was also investigated. The change in EELV (compared with a baseline breath) was significantly larger by ∼200 mL for all five EFL breaths (p<0.0001) (figure 6). This increase in EELV is fairly large and could potentially affect inspiratory mechanics.

Expiratory flow limitation index (EFLI) is associated with an increase in end-expiratory lung volume (EELV) (calibrated thoracoabdominal inductance plethysmography), consistent with increased expiratory resistance and reduced expiratory flow. B1–B5: breath number 1–5. a) EFLI >0.8 for all EFL breaths and EFLI <0.7 for all non-EFL breaths. b) ΔEELV for EFL breaths was significantly larger than for non-EFL breaths. EFLI was calculated from pneumotachograph flow.
Discussion
The major conclusions of the current study are that: 1) EFL is associated with prolapse/ballooning of the soft palate into the nasopharynx during expiration, 2) OSA patients with palatal prolapse on expiration are more likely to exhibit (isolated) palatal collapse on inspiration, and 3) the characteristic flow shape produced by expiratory palatal prolapse can be automatically detected with high sensitivity and specificity from the nasal pressure signal. These conclusions are based on the following results. 1) The instances of gold standard EFL (increased pharyngeal pressure without a concomitant increase in expiratory flow) were associated with palatal prolapse 89% of the time. 2) PP% (from endoscopy) or EFLI >0.8 (EFL%, from flow shape) was >25% in six out of seven patients with isolated palatal collapse. PP% and EFL% were <25% in 14 out of 15 patients who collapsed at other sites. 3) The instances of endoscopically determined palatal prolapse were identified by the EFLI with an accuracy of >95%. 4) The correlation between pneumotach-measured EFLI and nasal pressure-measured EFLI was >0.9 (p<0.0001).
Prolapse of the palate on expiration and EFL
Even though previous studies have reported expiratory-related obstruction [11–14, 25–30], these studies are primarily referring to the expiratory narrowing that occurs due to the drop in pharyngeal pressure across expiration [26, 28–30]. Therefore, this study is, to the best of our knowledge, the first to demonstrate that in some patients during expiration the palate/uvula prolapses or balloons into the airway (figures 1 and 2) causing a sudden reduction of expiratory airflow. These instances were associated with an increase in pharyngeal driving pressure (as shown in figure 1, expiratory positive pressure developed at the level of the epiglottis) and thus high expiratory resistance (>20 cmH2O·s·L−1) of the nasal respiratory route in >89% of the breaths examined. While Stanescu et al. [11] reported the presence of coupled inspiratory and EFL (constant or reduced flow associated with increased pressure at the level of supraglottis) in both nonapnoeic heavy snorers and OSA patients, they were not able to identify the mechanism underlying EFL. In this study, we demonstrate that palatal prolapse is the major mechanism responsible for EFL. Safar [31] and Safar and Redding [32] proposed the “valve-like” behaviour of the soft palate as a potential mechanism for expiratory obstruction. They reported expiratory obstruction during mouth-to-nose ventilation in obese anaesthetised patients and hypothesised it to be caused by this valve-like behaviour. More recently, Sato et al. [16] also described the valve-like obstruction of the soft palate as a potential mechanism for the expiratory obstruction during mask ventilation in anaesthetised patients with sleep disordered breathing. Our results add to this data by demonstrating, via direct observation of the soft palate and uvula, that the palate can indeed exhibit valve-like behaviour on expiration. Furthermore, we have shown that this behaviour can be easily recognised in the commonly measured nasal pressure signal.
In an experimental study, Woodson [14] used video imaging to examine how the pharyngeal structures moved during expiration produced by sudden decreases in nasal continuous positive airway pressure (CPAP). In contrast to our study, they did not observe palatal prolapse. However, this is likely due to differences between their experimental paradigm and our study of natural breathing during sleep. Reducing CPAP may not produce the forces needed to prolapse the palate.
Automation of detection of palatal prolapse
The present study also tests an algorithm for recognising palatal prolapse from the flow signal. A robust index (EFLI) was proposed and validated by natural sleep endoscopy (figure 4) and clinically measured nasal pressure (supplementary figure S4). We used pneumotach-measured flow to develop the index. However, since this methodology is intended to be used as a clinical tool, we validated it using the standard nasal pressure signal. Of note, EFLI does not depend on absolute (calibrated) values of flow, which facilitates implementation with uncalibrated flow signals. In addition, this index provides a continuous, normalised value for each breath. Ultimately, we envisage summarising breath-level data for an individual patient by, for example, reporting the proportion of breaths during sleep with EFLI >0.8 (per state or per position) or the proportion of scored obstructive respiratory events (hypopnoeas) associated with palatal prolapse.
Clinical significance of EFLI
Our study shows that palatal prolapse occurs in some OSA patients and causes EFL. We speculate that this phenomenon could be due to an elongated palate, a swollen uvula and/or redundant palatal tissue that moves more freely in the airway. Clinically, excessive fluttering and tissue movements related to prolapse could independently contribute to arousals. Furthermore, the shunting of flow through the mouth could lead to a switch to mouth breathing that, on its own, could increase upper airway collapsibility [33] (and decrease adherence to CPAP therapy [34]). Finally, the position of the palate in the nasopharynx may, in some cases, provide the preconditions for a compromised airway on the subsequent inspiration [11].
Interestingly, when palatal prolapse was present, it was found that the subsequent inspiratory times and tidal volumes were often reduced. The reason for this is that the airway pressure during inspiration must drop below a certain level (e.g. −5 cmH2O; supplementary figure S3) to dislodge the prolapsed palate and re-open the airway. This was clearly evident from our physiological measurements and endoscopic data (supplementary figure S3). This process diminished the inspiratory tidal volume and produced “skinny breaths” that, on a clinical sleep study, could be scored as hypopnoeas. Moreover, the associated increase in EELV due to palatal prolapse may itself diminish inspiratory flow, because more negative inspiratory pressures are now needed to produce inspiratory flow.
The changes in EELV produced by palatal prolapse could also be clinically important. It was found that a mean increase of 200–250 mL in the EELV during EFL (figure 6) may have a stabilising effect by improving the patency and collapsibility of the airway [35–37]. Increases in lung volume have also been shown to substantially decrease sleep disordered breathing [38] and the CPAP level required to eliminate flow limitation [39] in patients with OSA. Furthermore, Owens et al. [24] previously observed periods of spontaneous expiratory resistance (called EFL in our study) in a 37-year-old patient with severe OSA. They reported an association between EELV and expiratory positive airway pressure (EPAP), and suggested that expiratory resistance could increase EELV during sleep via generation of EPAP, potentially stabilising the upper airway during inspiration [24]. In this study, we showed that prolapse of the palate into the nasopharynx resulted in these periods of high expiratory resistance and EPAP build-up at the level of the epiglottis (figures 1 and 5). Therefore, the inactivation of the palatal valve leads to the reversal of the positive epiglottic pressure in non-EFL breaths (figures 1 and 5). This transition from EFL to non-EFL periods could potentially be due to arousal (figure 5) and/or increased EELV above a threshold (figure 1); however, this needs further investigation.
This previously underappreciated pattern of pharyngeal collapse, quantified by EFLI, may be indicative of a certain airway phenotype. Further studies are need to test whether the EFLI can help identify patients who respond to specific therapies, such as uvulopalatopharyngoplasty [40, 41], added nasal expiratory resistance therapy (Provent) [42], EPAP [12, 13], mandibular advancement devices [43], positional therapy [44, 45] and upper airway stimulation therapy [46, 47]. Our results show that palatal prolapse is more frequent in the supine than the lateral position. We speculate that patients with higher EFLI may be less responsive to mandibular advancement devices and upper airway stimulation for the following reason. For the palate to prolapse on expiration, it likely needs to be large or elongated and it must separate from the tongue base (i.e. there is less tethering between the palate and tongue). Mandibular advancement and upper airway stimulation, which presumably move the tongue anteriorly, may be less effective at also moving the palate anteriorly in such patients.
Limitations
This study has several limitations. First, due to the invasiveness of the study and the inherent challenges in performing endoscopy during natural sleep in OSA patients, our sample size was relatively modest (n=22). Nevertheless, the number of breaths (1211 breaths) examined was large enough that different expiratory flow patterns were equally well represented. Importantly, the threshold was obtained from 50% of the data (training set) and validated on the remaining 50% of the data (testing set) that were not used to find the threshold. This ensures the robustness of the EFLI in detecting expiratory prolapse. A second limitation relates to the selection of breaths to obtain PP% (figure 3) as an indicator of inspiratory isolated palatal collapse. Therefore, further studies will be necessary to validate the 25% cut-off value in routine clinical polysomnography. A third limitation relates to the storage of large video files during endoscopy. For every 1 min of recording, the system produced ∼1.1 GB of data, which limited our ability to store the video files continuously throughout the night. Nevertheless, we recorded an average of 150±49 min of endoscopic images per subject during the night to have a well-represented library of different sites of collapse/flow patterns. Also, the video files were stored in small files every 5–10 min to prevent missing frames and desynchronisation between the signals and videos.
Conclusions
In this study, an automated algorithm was developed to objectively identify breaths with palatal prolapse as distinct from other sites of obstruction. We demonstrate that palatal prolapse is characterised by the presence of a sudden decrease in expiratory flow that results in an EFLI >0.8. Our algorithm was also able to accurately characterise patients who had isolated inspiratory palate collapse. As the presence of palatal prolapse seen using endoscopy may have implications for success versus failure of OSA therapies [12, 13, 40, 41], we envisage that our algorithm will enable rapid, noninvasive identification of palate involvement without requiring invasive endoscopy.
Supplementary material
Supplementary Material
Please note: supplementary material is not edited by the Editorial Office, and is uploaded as it has been supplied by the author.
Supplementary material ERJ-01419-2017_Supplement
Footnotes
This article has supplementary material available from erj.ersjournals.com
Conflict of interest: S.A. Sands reports grants from American Heart Association (AHA) and National Institutes of Health (NIH) during the conduct of the study, and personal fees for consultancy from Cambridge Sound Management, outside the submitted work.
Conflict of interest: L. Taranto-Montemurro reports grants from the NIH during the conduct of the study, and grants from the AHA and personal fees from Novion Pharmaceuticals and Cambridge Sound Management, outside the submitted work. D.P. White reports personal fees from Philips Respironics (for acting as Chief Scientific Officer), Apnicure (for acting as Chief Medical Officer) and NightBalance (for consultancy), outside the submitted work.
Conflict of interest: A. Wellman reports grants from the NIH and Philips Respironics during the conduct of the study, and grants from Varnum Sleep and Breathing Solutions, and Cambridge Sound Management, and personal fees from Bayer, outside the submitted work; in addition, A. Wellman has a patent Airway and Airflow Factors issued.
Support statement: This work was performed at the Brigham and Women's Hospital and was supported by philanthropic funding from Fan Hongbing (President of OMPA Corporation, Kaifeng, China) and research grants from Philips Respironics and the National Institutes of Health (R01HL102321, R01HL128658, P01HL095491, UL1RR025758). S.A. Sands was supported by the American Heart Association (15SDG25890059) and the American Thoracic Society Foundation. L. Taranto-Montemurro was supported by a grant from the American Heart Association (17POST33410436). M. Marques and P.R. Genta were supported by Fundação de Amparo à Pesquisa do Estado de São Paulo (FAPESP). Funding information for this article has been deposited with the Crossref Funder Registry.
- Received July 13, 2017.
- Accepted November 29, 2017.
- Copyright ©ERS 2018
References


