


Abstract
Computed tomography (CT) is the modality of choice for imaging the thorax and lung structure. In chronic obstructive pulmonary disease (COPD), it used to recognise the key morphological features of emphysema, bronchial wall thickening and gas trapping. Despite this, its place in the investigation and management of COPD is yet to be determined, and it is not routinely recommended. However, lung CT already has important clinical applications where it can be used to diagnose concomitant pathology and determine which patients with severe emphysema are appropriate for lung volume reduction procedures. Furthermore, novel quantitative analysis techniques permit objective measurements of pulmonary and extrapulmonary manifestations of the disease. These techniques can give important insights into COPD, and help explore the heterogeneity and underlying mechanisms of the condition. In time, it is hoped that these techniques can be used in clinical trials to help develop disease-specific therapy and, ultimately, as a clinical tool in identifying patients who would benefit most from new and existing treatments. This review discusses the current clinical applications for CT imaging in COPD and quantification techniques, and its potential future role in stratifying disease for optimal outcome.
Abstract
CT imaging has an important and rapidly developing role to play in the assessment of COPD http://ow.ly/ZREg3
Introduction
Computed tomography (CT) has revolutionised medical imaging since it was developed in the 1970s. Its ability to provide detailed images of the lungs and thorax has made it an imaging modality of choice in respiratory medicine, where it has become an essential tool in the assessment and management of patients with many lung diseases.
In chronic obstructive pulmonary disease (COPD), CT can image the pathological changes that directly contribute to the airflow limitation that defines the condition [1]. Reliance on using spirometric markers to diagnose and characterise the disease has limited both our understanding of COPD and the individualised clinical management of the condition. COPD is a complex, heterogeneous condition with varying clinical features, consisting of a number of different phenotypes. The origins of clinical phenotypes and the associations of disease processes with endotypes along with the drivers to heterogeneity between individuals have not been fully explored, and are likely to have important implications for understanding disease progression and the future management of this condition [2]. There are currently no significant disease-modifying medications for COPD and there have not been the improvements in outcome seen in other chronic diseases. Other tools are required in addition to spirometry to help explain the heterogeneity, and provide further insights into approaches to study and treat COPD. CT has current practical applications in the routine management and investigation of the disease, and with the development of novel analysis techniques, has the potential to provide further details about the pulmonary and extrapulmonary manifestations of COPD.
CT in current clinical practice
Prior to the 1970s, histological and post mortem studies were required to study structural changes of the lung. The introduction of CT made it possible to visualise the thorax and assess lung structure noninvasively. In COPD, CT can identify key morphological features, including emphysema, bronchial wall thickening and gas trapping. These pathologies contribute directly to airflow obstruction and, therefore, CT has the potential to provide vital insights into the underlying pathophysiological changes of COPD. Despite this, routine CT imaging has not necessarily been widely adopted in clinical practice, and its place in the management and investigation of COPD has not been firmly established. The Global Initiative for Chronic Obstructive Lung Disease (GOLD) strategy does not routinely recommend CT scanning in COPD and only advises that it may be helpful in differential diagnosis or when surgical options are being considered [3]. This general ambivalence is highlighted by a study of attitudes in respiratory physicians and surgeons in the UK where only 32% thought it necessary for patients with severe COPD to have a CT scan [4].
There are a number of reasons why the use of CT has not become routine in COPD. One of the most important is the perceived notion that using CT does not alter management, although this is not strictly true. NETT (the National Emphysema Treatment Trial) demonstrated that patients with advanced upper lobe emphysema and limited exercise ability improved after lung volume reduction surgery [5]. There has also been considerable progress and experience in using endobronchial treatments for severe emphysema including coils, valves, sealant and airway bypass. In the correct patients with severe heterogeneous emphysema, these treatments can lead to significant improvement in pulmonary physiology and functional capacity [6, 7]. CT imaging can also identify bullous disease that may be amenable to surgery and bullectomy can lead to improved health status [8]. It therefore seems clear that patients with severe COPD require CT imaging to determine which patients are appropriate for these techniques.
CT imaging can also detect concomitant pulmonary pathology in COPD. Bronchiectasis is particularly prevalent, with studies demonstrating 50% of COPD patients having CT evidence of the disease [9–11]. When present, bronchiectasis is associated with worse airflow obstruction [11], increased exacerbations [9, 11], higher airway and systemic inflammation [9–11], and higher mortality [9]. COPD is also an independent risk factor for lung cancer [12], and higher cancer rates have been associated with worsening airflow obstruction [13, 14] and emphysema [15, 16]. Fibrotic change has also been shown to be common in COPD and seems to confer a poor prognosis [17]. In addition, it can be difficult to diagnose due to the fact that pulmonary physiology may be normalised by the opposing effects of hyperinflation and fibrosis. As these concomitant pathologies are common and often associated with poorer outcomes, and would require a change management, it is vital that CT imaging is used to detect them.
A major limitation to the routine use of CT in COPD has been subjective reporting, making it difficult to interpret the results and guide management plans or give insights into the disease. Objective methods have been targeted to provide numerical data on key disease facets. Initially, simple visual scoring systems were developed, which showed early promise at quantifying the disease. These techniques were unable to detect subtle disease, and were liable to intra- and interobserver errors, as well as being insensitive to longitudinal change. To address these issues, automated quantitative analysis techniques have been developed, which are able to segment the lung parenchyma and airways from the chest wall and surrounding structures. Early software analysed two-dimensional axial slices but, coupled with advances in CT technology, a range of different analysis software exists that allows volumetric reconstructions (figure 1). This raises the prospect that quantitative CT analysis can be used to understand the disease and phenotypes in more detail, which the remainder of this review discusses.
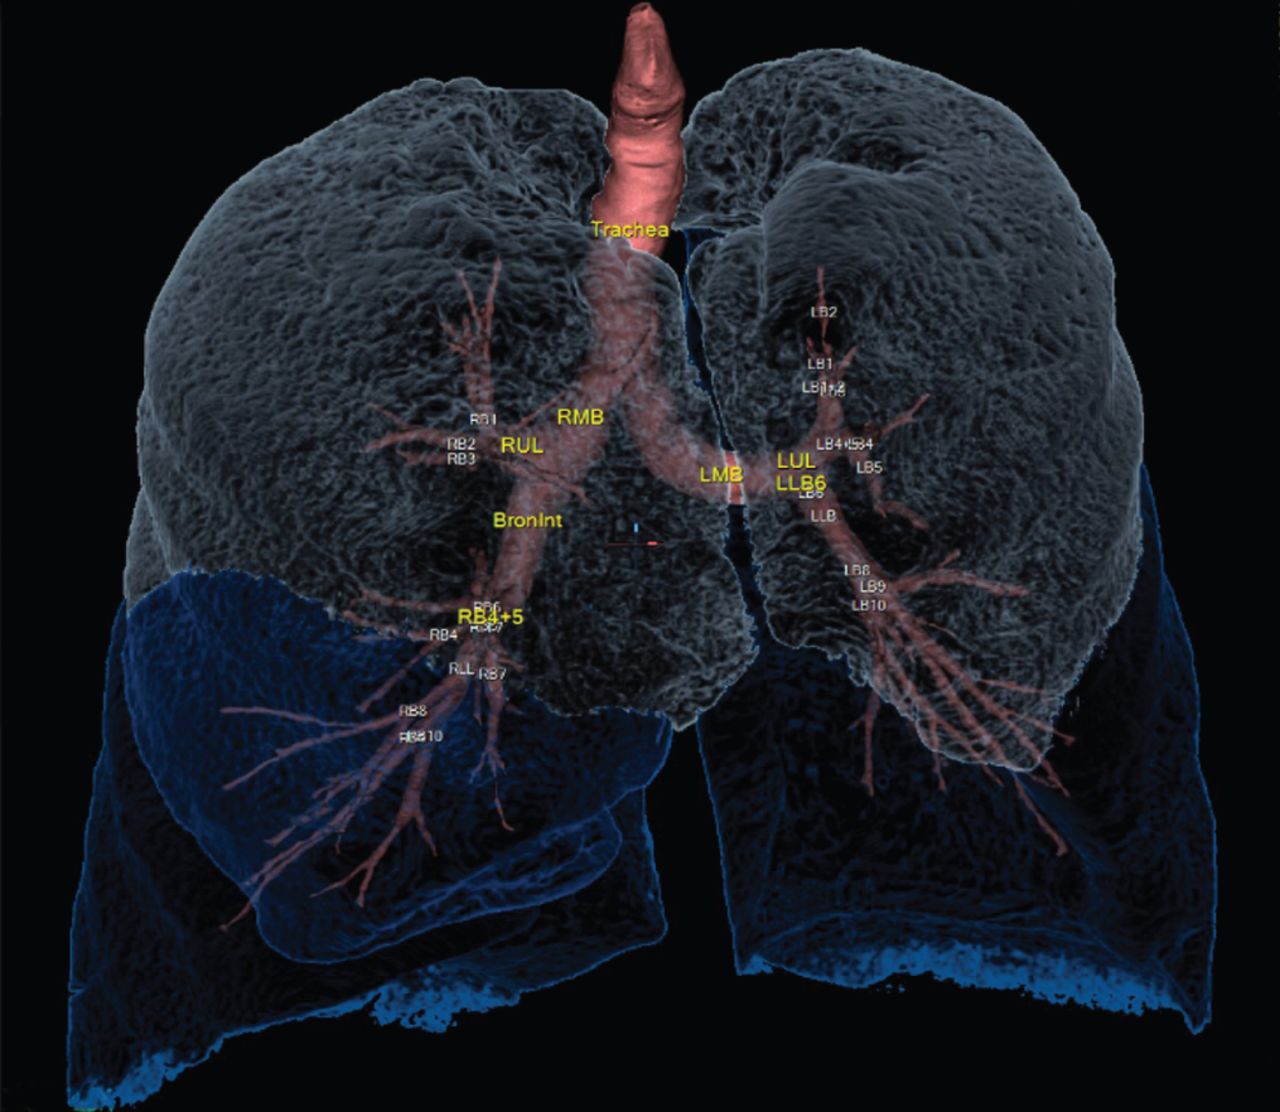
Volumetric computed tomography reconstruction of bronchial tree and lung parenchyma using Apollo software (VIDA Diagnostics Inc., Coralville, IA, USA).
Emphysema
Emphysema is traditionally a histological diagnosis, defined as an abnormal permanent enlargement of air spaces distal to the terminal bronchioles, accompanied by the destruction of alveolar walls. Emphysematous changes can be identified on CT and, in 1978, Rosenblum et al. [18] described areas of lower lung attenuation and mean lung density in patients with a clinical diagnosis of COPD.
To provide numerical data on emphysema, Goddard et al. [19] developed a visual scoring system for emphysema by estimating the amount on axial CT slices, which showed a strong association with airflow obstruction and with histological specimens [20–22]. Automated techniques were developed to segment the lung parenchyma and quantitate emphysema. The two main techniques both use the principle that emphysematous regions are represented by low-attenuation areas on CT. The first, termed CT densitometry, involves applying a density mask to the lung parenchyma and setting a threshold below which all voxels are assumed to be emphysema, giving a low-attenuation percentage (%LAA) (figure 2). Initially, a threshold of −910 HU was used, which showed a strong correlation with pathological measures of emphysema [23]. Subsequently, %LAA under −950 HU (%LAA< −950) was shown to have the strongest associations with both microscopic and macroscopic emphysema [24–27], leading to the common adoption of this threshold. The second method, termed percentile densitometry, involves choosing a threshold percentile in the attenuation distribution curve, which provides the density value in Hounsfield units under which a percentage of the voxels are distributed. A number of different thresholds between 1% and 18% have been used, and correlate strongly with microscopic emphysema on histological specimens [27]. The most commonly used threshold is 15% based on a number of studies in α1-antitrypsin deficiency (α1-ATD) [28–30]. There is still no definite consensus about which of these methods is best and, even now, different studies use different thresholds. Given the fact that emphysema is an all-or-nothing phenomenon, it seems more intuitive to use CT densitometry, which uses an absolute cut-off to quantify it.

Coronal reconstruction of chest computed tomography showing low-attenuation areas below −950 HU.
Studies have confirmed that CT densitometry demonstrates higher levels of emphysema in individuals with COPD than in healthy smokers [31–34]. There is also convincing evidence that CT densitometry has strong associations with airflow obstruction [10, 32–41], and analysis of over 4000 CT scans from the COPDgene study showed a strong negative correlation between %LAA< −950 and forced expiratory volume in 1 s (FEV1), and demonstrated increased emphysema with worsening GOLD severity [33]. CT densitometry also has strong associations with gas transfer (transfer factor of the lung for carbon monoxide) [10, 35–40], 6-min walk distance (6MWD) [32, 36, 40, 42], BODE (body mass index, obstruction, dyspnoea, exercise capacity) score [36, 39, 43–45] and body composition [37, 39, 46, 47].
These densitometry techniques do not take into account the distribution or different subtypes of the disease, which may have important implications. Emphysema does not affect the lung in a uniform way and it is unclear how this affects the clinical presentation of the disease. As previously discussed, it has been shown to be clinically important in determining which patients benefit from lung volume reduction surgery [5]. A small study found that %LAA was higher in central and upper regions within the lung [48]. Interestingly, airflow limitation correlated best with %LAA in the central and lower regions, and also found that more homogenous emphysema was associated with worse airflow obstruction. Other studies have shown accelerated decline in lung function in those with homogenous emphysema [49] and those with more upper-zone emphysema [50]. With advances in quantitative CT analysis, lobar variation of disease can be assessed and significant differences in emphysema quantity between the lobes has been found [51, 52].
Three distinct patterns of emphysema have been described in histological studies, based on the distribution within the secondary pulmonary lobule: centrilobular, panlobular and paraseptal emphysema. CT imaging can visualise these different subtypes. One study using a visual scoring system found that centrilobular emphysema was the most common subtype but over half of patients with emphysema had multiple subtypes [53]. An automated method, called local histogram-based emphysema patterns, involves dividing the lung into small cubes and analysing the subtype of emphysema present in each cube. This was found to be more predictive of lung function than %LAA< −950 [54].
These data point to CT densitometry and other methods being able to accurately quantify emphysema and its association with physiological markers of disease. To validate CT imaging as a biomarker of disease, it is necessary to compare it to underlying disease mechanisms and outcome measures, and track longitudinal change. CT densitometry has been found to correlate with mortality in patients with COPD [55] and analysis from the GenKOLS trial [56] found that %LAA had a better predictive value for respiratory and cardiac mortality than GOLD staging. Emphysematous change on CT has also been associated with higher exacerbation rate [57–59] and increased mortality from exacerbations [59].
A potentially important application of CT imaging is to track the changes in emphysema over time and see how it contributes to functional decline. Until recently, the majority of these studies were conducted in patients with α1-ATD and have shown that CT densitometry can accurately detect progression of emphysema [60–63] and correlates with decline in lung function [29, 60]. Furthermore, CT lung density parameters are more sensitive in detecting progression of disease than traditional lung function [60] and have therefore been accepted as the primary end-point in prospective studies on treatment effects for α1-ATD. In COPD, it has been demonstrated that patients with higher quantities of emphysema on CT have an increased rate of decline of FEV1 [34, 50]. CT emphysema progression is also associated with frequent exacerbations [64] and current smoking status [65]. The largest longitudinal study to date assessed CT scans from the Evaluation of COPD Longitudinally to Identify Predictive Surrogate Endpoints (ECLIPSE) cohort [66], in which it was found that lung density and low-attenuation areas progressed on an annual basis. There were, however, significant variations between subjects and this did not convincingly correlate with lung function.
When comparing CT measures of emphysema with underlying markers of disease, it has to be considered that our knowledge of these mechanisms is imprecise. Emphysematous change has been associated with various matrix metalloproteinases (MMPs) [31, 67–69] as well as raised sputum neutrophils [70] and eosinophils [39, 71]. A number of airway inflammatory cytokines, such as interleukin-8, leukotriene-B4 and myeloperoxidase, has been associated with emphysema progression [39, 72, 73] and emphysema has also been associated with raised serum fibrinogen [74]. Some work has been performed associating novel biomarkers with emphysema and in the ECLIPSE cohort, surfactant protein D and soluble RAGE (receptor of advanced glycation end-products) were both associated with decline in lung densitometry [66]. Little is known about bacterial colonisation and emphysema; however, Bafadhel et al. [75] did not find any difference in bacteria culture between patients who had emphysema on CT and those who did not.
In summary, emphysema quantitation is relatively simple and can be performed with minimal user intervention. CT densitometry is associated with a number of physiological and clinical parameters. However, further work is required to evaluate emphysema distribution and subtypes, and to assess the longitudinal changes in emphysema, and the association with outcome markers of disease and underlying disease mechanisms.
Bronchial wall measurements
Airway wall remodelling is an important feature in COPD and histological specimens confirm airway wall thickening throughout the bronchial tree [76, 77]. The limited resolution of CT means only large and intermediate-sized airways can be visualised directly. Early measurements of the airway relied on manual tracing [78]; however, a number of automated methods have been developed. One of these involves using the “full width at half maximum” principle (figure 3), which uses CT attenuation values to identify the inner and outer airway wall by projecting rays from the centre of the airway. These and other algorithms have been refined, and using region-growing approaches, it is now possible to generate three-dimensional reconstructions of the bronchial tree down to the fifth or sixth generation airway. Multiple airway dimensions can be measured from these reconstructions including bronchial wall thickness, wall area, lumen area, total airway area, wall area percentage (%WA) and internal perimeter (Pi) (figure 4). A standardised parameter called Pi10 has been developed that predicts the square root of the wall area for a hypothetical airway with an internal perimeter of 10 mm.

Full width at half maximum method for determining airway wall dimensions.

Airway wall dimensions. Aaw: airway wall area; T: wall thickness; Ao: total airway area; Ai: inner area; Pi: internal perimeter; %WA: percentage wall area.
Early studies found that markers of bronchial wall thickening on CT were increased in COPD [46, 79–81]. However, more recent studies have shown that both airway wall and lumen size are reduced in COPD, although proportionally the lumen more so, resulting in a larger %WA [33, 79, 82]. The reasons for the discrepancies are unclear although the later studies tended to make more complete measurements of the bronchial tree and spatially matched the airways. By not doing this, there is a chance of introducing bias into results by inadvertently selecting more proximal airways in COPD, which have thicker walls. This highlights the current difficulties in measuring the airways, with the sheer number of variables presenting significant challenges, and it is clear that further research is needed.
Taking the above limitations into account, measures of increased bronchial wall thickness are associated with FEV1 [41, 81, 83, 84] and this is stronger with more distal airways [41]. Bronchial wall markers also correlate with functional markers in the form of the BODE index [44, 45], exercise capacity [32, 36] and body composition [46]. Although statistically significant many of these associations tended to be quite weak. In the GenKOLS study, there was generally no increase in mortality with increased Pi10 but in a subgroup with severe emphysema, Pi10 was associated with mortality [56]. Another study demonstrated that increased bronchial wall dimensions were associated with mortality from exacerbations [59]. It has been hypothesised that increased bronchial wall thickness is a marker of airway inflammation and therefore would be associated with symptoms of chronic bronchitis or frequent exacerbations. Han et al. [57] confirmed this by showing that markers of airway wall thickness were increased in frequent exacerbators, although another study failed to find this association [58]. These measures also show associations with symptoms of chronic bronchitis [84, 85]. Few studies have investigated the link between CT markers of bronchial wall thickening and sputum inflammatory markers or bacterial culture, although Bafadhel et al. [75] did not find any association.
Simply measuring markers of bronchial wall thickness may be insufficient to describe the airway remodelling that occurs in COPD. Other methods have therefore been developed and one of these uses peak wall attenuation, which is a marker likely to reflect thickening and density within the airway wall. This has been shown to have a negative correlation with FEV1 [41, 86].
Minimal work has assessed the change of airway dimensions over time. A small study looked at lower lobe segmental airway changes between scans a year apart and did not find a significant difference, although did find a correlation between annual change in %WA and FEV1 decline [87]. Regional variability in bronchial wall thickness has not been systematically analysed. Ohara et al. [88] did not find any difference between the apical upper lobe segmental bronchus and lower lobe segmental bronchus.
In theory, CT should be a useful tool at assessing the morphology of the large and intermediate-sized airways. However, there are still many uncertainties regarding this technology and measurements, and no definite evidence has shown that this is a particularly useful tool in COPD.
Small-airway disease
The small airways are the main contributor to the airflow obstruction seen in COPD [77], and histological studies confirm epithelial metaplasia, goblet cell hyperplasia and peri-bronchial fibrosis. There is currently no gold standard for measuring this small-airway disease and so better methods are required, and considerable research is ongoing in this area. CT cannot image the small airways directly as they are beyond the maximum resolution. The indirect sign of gas trapping can be used as a surrogate marker, which is defined as lack of volume reduction after expiration and is seen as low-attenuation areas on expiratory CT.
A number of quantification methods have been developed to measure gas trapping and the simplest of these involve calculating the number of voxels below −856 HU or the mean lung density (MLD) on expiratory CT. These methods do not compensate for the amount of emphysema and so, in effect, will be a combined score for gas trapping and emphysema. To correct for this, techniques using paired inspiratory and expiratory scans have been developed, which include using the ratio of MLD in expiration to inspiration. Matsuoka et al. [89] developed a more complex technique using the relative volume change between −856 and −950 HU between inspiratory and expiratory scans. This was validated in a study of 36 patients, and found strong associations with pulmonary function test markers of gas trapping and was superior to the other methods described above. When comparing these techniques to single-breath nitrogen washout, expiratory to inspiratory MLD ratio exhibited the best performance [90]. A large trial investigating gas trapping in COPDgene subjects found that paired (inspiratory and expiratory) samples were more predictive of pulmonary function in those with severe emphysema than just using the expiratory scan [91]. It therefore seems logical that any CT marker investigating gas trapping excludes emphysema by using paired inspiratory/expiratory scans.
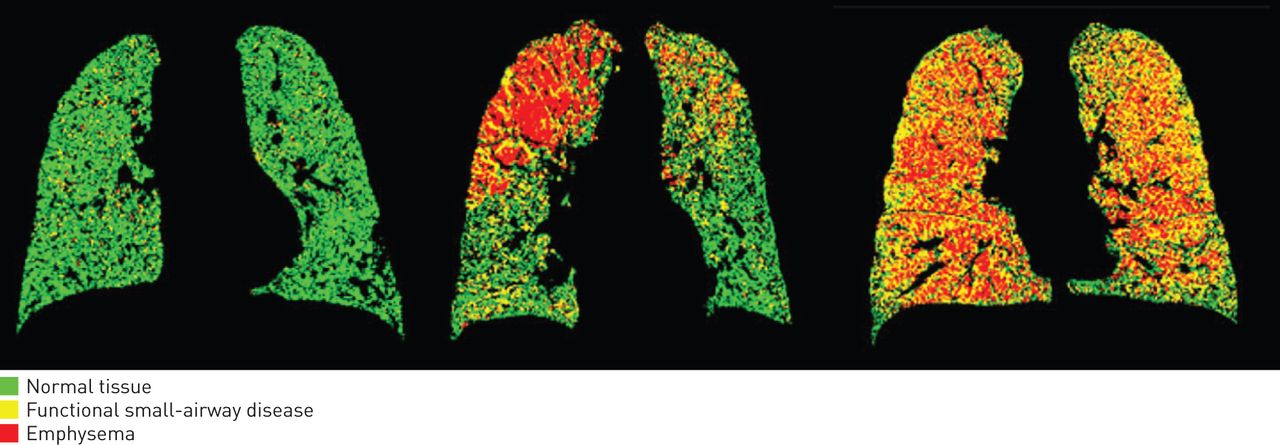
Most studies investigating gas trapping have simply associated it to physiological parameters of disease where it has been found to correlate with FEV1 and other lung function parameters [31–33, 36, 38, 92–94], and with worsening GOLD status [32, 92]. Few studies have investigated the link between gas trapping on CT and underlying mechanisms of disease. Our work has shown that CT markers of small-airway disease are associated with a number of MMPs (MMP-3, MMP-7, MMP-8, MMP-9, MMP-10 and MMP-12), suggesting these play a key role in small airways remodelling in COPD [31]. The longitudinal changes and the distribution of gas trapping throughout the lungs are unknown. More recently, novel CT methods of investigating small-airway disease have been developed, termed parametric response mapping (PRM), which involves co-registering inspiratory and expiratory scans so that voxel-by-voxel comparison can be performed (figure 5) [95]. This allows determination of emphysema and functional small-airway disease, and has been shown to subgroup patients effectively, which correlated with pulmonary function testing. Functional small-airway disease measured in the COPDgene cohort was independently associated with decline in FEV1 and this was especially the case with milder patients [96]. This and other similar techniques offer the opportunity to characterise disease phenotypes, and has the potential to monitor disease status, so considerable research is ongoing.
Parametric response mapping from computed tomography scans in three individuals. Reproduced and modified from [95] with permission from the publisher.
In summary, using paired inspiratory and expiratory scans, CT imaging can effectively measure gas trapping, although the optimum method has yet to be defined. Valid questions exist about whether gas trapping is truly a surrogate marker of small-airway disease, although it does show strong associations with pulmonary function measures of small-airway disease. Further work is needed to see how underlying mechanisms of disease associate with gas trapping and whether this parameter reflects changes in lung function over time.
Other pulmonary morphological features
There have been efforts to develop quantitative analysis for pulmonary features other than those discussed above. An automated method for bronchiectasis has been developed where the ratio of airway inner diameter to adjacent vessel diameter can be quantified [97]. This has shown the burden of bronchiectasis is higher with increasing airflow obstruction and is associated with increased exacerbations. Further work is required to refine and automate this technique.
There has also been interest in using CT-measured lung density as a marker of pulmonary inflammation. Increased lung density has been found in current smokers as opposed to never/ex-smokers [98–100], and has been associated with greater smoking history [99, 100] and inflammatory cells in bronchoalveolar lavage [98]. Interestingly, in a longitudinal study, lung density decreased after smoking cessation [100], suggesting smoking causes increased lung density, possibly through pulmonary inflammation. This may prove to be a potential tool in evaluating early lung disease prior to structural changes occurring in COPD.
Pulmonary vascular imaging is an active area of research, as pulmonary vascular disease is well described in COPD and is a significant predictor of mortality [101–103]. The pulmonary artery diameter and ratio of pulmonary artery diameter to aorta diameter is associated with direct measures of pulmonary artery pressures [104] and higher exacerbation rates [105]. Cross-sectional area of small pulmonary vessels on CT is correlated strongly with invasive measures [106]. A technique to automatically segment and create a three-dimensional model of the pulmonary vasculature, allowing blood volume to be calculated, has been developed [107] and subjects with more emphysema had less blood volume. Further work is required to demonstrate the clinical utility of this.
Extrapulmonary manifestations
COPD has multiple systemic manifestations and CT of the chest is able to capture some of this information. Cachexia and skeletal muscle wasting are a significant problem in COPD, and body mass index (BMI) is associated with airflow obstruction, disease severity and mortality [108, 109]. There is growing recognition that other markers of body composition, such as fat-free mass index (FFMI), may be more important, as they are a better marker of skeletal muscle dysfunction. FFMI has been shown to be a predictor of mortality independently of fat mass or BMI [110, 111]. A technique to assess pectoralis muscle area on CT showed significantly reduced muscle area in COPD versus healthy controls and was associated with GOLD staging [112]. This was also associated with functional markers of disease including the BODE index, MRC (Medical Research Council) dyspnoea score and 6MWD [112]. Various fat compartments can also be assessed including anterior chest wall subcutaneous fat and intra-abdominal fat, which have shown some clinical correlations. These methods are all relatively crude and still require significant user input.
Osteoporosis is also common in COPD [113] and bone mineral density has been identified as being independently associated with airflow obstruction [114, 115]. Vertebral body attenuation values can be measured by CT and is associated with bone mineral density on dual-energy X-ray absorptiometry [116], and has also show associations with airflow obstruction [117] and exacerbation rate [118].
Using CT to define phenotypes in COPD
A main aim of COPD research is to define clinically meaningful phenotypes, and measuring morphological changes in isolation does not really help. More complex analysis that combines all of these morphological features is needed. One study separated patients into three subgroups: A phenotype had minimal emphysema, E phenotype had emphysema and no bronchial wall thickening, and M phenotype had both. A phenotype was associated with higher BMI, older age of onset of symptoms of breathlessness, fewer pack-years of smoking exposure and better lung function. Both A and M had more evidence of reversibility and higher sputum eosinophils. In another study, patients were split into emphysema-predominant and airway-predominant groups [57], and showed that emphysema patients had lower FEV1, and were more functionally limited, with higher BODE scores and lower BMI. Castaldi et al. [119] performed cluster analysis on the COPDgene cohort incorporating quantitative CT analysis. They successfully grouped subjects into four clusters that had their own individual attributes. Other studies have also clustered subjects based on emphysematous change and bronchial wall thickening on CT scans [120]. Clinical applications of these phenotyping methods have thus far not been demonstrated.
Other imaging modalities
Although CT is the imaging modality of choice for providing structural images of the lung, one of the major drawbacks is its inability to provide functional imaging. CT can, however, be combined with other imaging modalities to provide functional data in COPD. Positron emission tomography (PET)-CT and single-photon computed tomography (SPECT) are nuclear medicine scans that combine radioisotopes with CT imaging, allowing both functional and molecular imaging studies with anatomical co-registration. Small molecules, peptides or proteins are labelled with radioactive atoms that emit high-energy photons, which can be detected by PET or SPECT. For PET-CT, 18F-fluorodexoxyglucose (FDG) is the most commonly used radiolabel; it is taken up by metabolically active tissues and can be used as a marker of pulmonary neutrophilic inflammation. Uptake is significantly increased in COPD [121], and is associated with FEV1 and emphysema severity [121, 122]. With SPECT, perfusion and ventilation imaging can be performed with either a vascular or inhaled tracer.
Magnetic resonance imaging (MRI) is another modality that can provide functional images of the lungs in COPD [123, 124]. There are a number of challenges in using magnetic resonance to image the lungs, including the low concentrations of protons, multiple air–tissue interfaces and relatively poor spatial resolution. Until recently, the main pulmonary application was in evaluating the pulmonary vasculature using contrast-enhanced imaging. Advances in technology, especially using oxygen-enhanced or hyperpolarised noble gases to increase the signal, allow functional imaging of ventilation and have shown ventilation defects in COPD [125]. Some studies have combined functional MRI with the structural images seen on CT. One such study assessed pulmonary microvascular blood flow, and found it was reduced in COPD and was associated with degree of emphysematous change [126]. Another study compared ventilation and perfusion defects measured on MRI with PRM measurements of emphysema and small-airway disease on CT. Ventilation defects were associated with emphysema and small-airway disease, and diffusion measurements were significantly raised in areas of gas trapping [127]. Magnetic resonance technology is still in early development but does provide an advantage over CT by allowing functional imaging and, importantly, being radiation free. Despite this, magnetic resonance is limited by availability, cost, the complexity of image analysis required and relatively poor spatial resolution.
Future use of CT in research and management
Further work is required to confirm quantitative CT analysis as an imaging biomarker of disease that can be used practically to manage patients with COPD and as a useful research tool to give insights into the disease. From a technical point of view, CT protocols need standardising as radiation dose, slice thickness and reconstruction algorithms can all effect analysis. Methods for quantifying the various morphological features need optimising, and this is especially the case for airway measurements and gas trapping. More sophisticated tools may be needed that do not just simply quantify results but also take into account other features, including emphysema subtypes and airway wall attenuation. Measures for detecting extrapulmonary manifestations are also in early development and further research is required to optimise these.
CT analysis needs to be assessed against outcome measures and markers of disease activity. To date, there have been relatively few longitudinal studies and these have shown variable results. It is vital studies are performed to track CT changes over time to get an accurate picture of the progression of the disease and how effective CT imaging is at capturing this. There have also been relatively few studies assessing quantifiable CT markers of disease and markers of underlying biological disease activity, which includes inflammatory markers, microbiology, proteases and other biomarkers. The approach taken in our study highlights how this can be achieved by combining bronchoscopic sampling and CT imaging to demonstrate a potentially important association between proteases and small-airway disease in COPD [31]. Similar approaches can be used to further our understanding of the active disease processes and endotypes occurring in different compartments and regions of the lung, hopefully allowing the development of novel targeted therapies.
Enhancing CT technology will also increase its application in COPD. A major limiting factor is the radiation dose and associated cancer risks. Dose reduction strategies are vital if longitudinal scans are to be considered. Dual-energy CT technology is being developed that allows functional imaging of the pulmonary vasculature and will have further applications. CT imaging could also be augmented with other imaging tools to provide more information about disease activity. PET-CT and SPECT are current examples, but these could be enhanced with development of novel molecular probes targeting key features of COPD. CT could also be co-registered with MRI to combine structural and functional imaging.
One of the most important questions is how to utilise CT analysis to define clinically important phenotypes. It is unlikely that simply subgrouping patients into emphysema and airway-predominant disease will be sufficiently helpful to guide treatment options. Cluster analysis and other statistical modelling techniques may provide interesting results but are more likely to be research tools with few practical clinical applications. Emphysema and bronchial wall thickening on CT have already been associated with increased mortality [55, 56, 59], and refining this information and combining it with clinical parameters may help enhance multidimensional prognostic tools such as the BODE index.
This technology may have a significant impact in clinical trial and drug discovery work in COPD. Quantitative CT has already been used as an outcome marker for emphysema progression in α1-ATD, and this could be extended for drugs targeting airway inflammation and small-airway disease. The heterogeneity of the disease causes significant challenges in clinical trial design. Most trials include unselected populations of patients. and therefore have to enrol large numbers and last considerable time to identify sufficient responders. Improving knowledge of patient heterogeneity is vital for optimising drug trials and quantitative CT may play an important role. Potentially, CT could be used to stratify study subjects into phenotypic groups that would be most likely to respond to the investigational drug. For example, roflumilast targets airway inflammation but study results have been underwhelming. CT could be used to define which patients have evidence of airway thickening/inflammation and this subject group could be used in any interventional study. Improving stratification of study subjects may increase treatment effects and reduce variability in response, thereby increasing the chances of novel drugs being developed. This will, in turn, lead to further clinical applications for CT imaging in determining which patients may benefit from novel pharmaceutical agents.
Conclusion
CT imaging has an important and rapidly developing role to play in the investigation of COPD, where it can aid diagnosis and provide information on significant concomitant disease, and can be used to plan interventional strategies for those with severe disease. It is also able to image the key pulmonary and extrapulmonary manifestations of the disease but the challenge has been how to utilise this information. Quantitative analysis shows promise in objectively measuring these disease features, and many have associations with traditional clinical and physiological markers of disease. These techniques are likely to be used initially as an important research tool with which to understand disease heterogeneity and aid our understanding of the key biological mechanisms in COPD. This understanding will aid optimal patient selection into clinical trials and translation of these approaches into clinical practice may help guide individualised management strategies and improve outcomes.
Footnotes
Conflict of interest: Disclosures can be found alongside the online version of this article at erj.ersjournals.com
- Received January 7, 2016.
- Accepted March 21, 2016.
- Copyright ©ERS 2016
References


Jump To
- Article
- Abstract
- Abstract
- Introduction
- CT in current clinical practice
- Emphysema
- Bronchial wall measurements
- Small-airway disease
- Other pulmonary morphological features
- Extrapulmonary manifestations
- Using CT to define phenotypes in COPD
- Other imaging modalities
- Future use of CT in research and management
- Conclusion
- Footnotes
- References
- Figures & Data
- Info & Metrics